Bill’s Commentary:
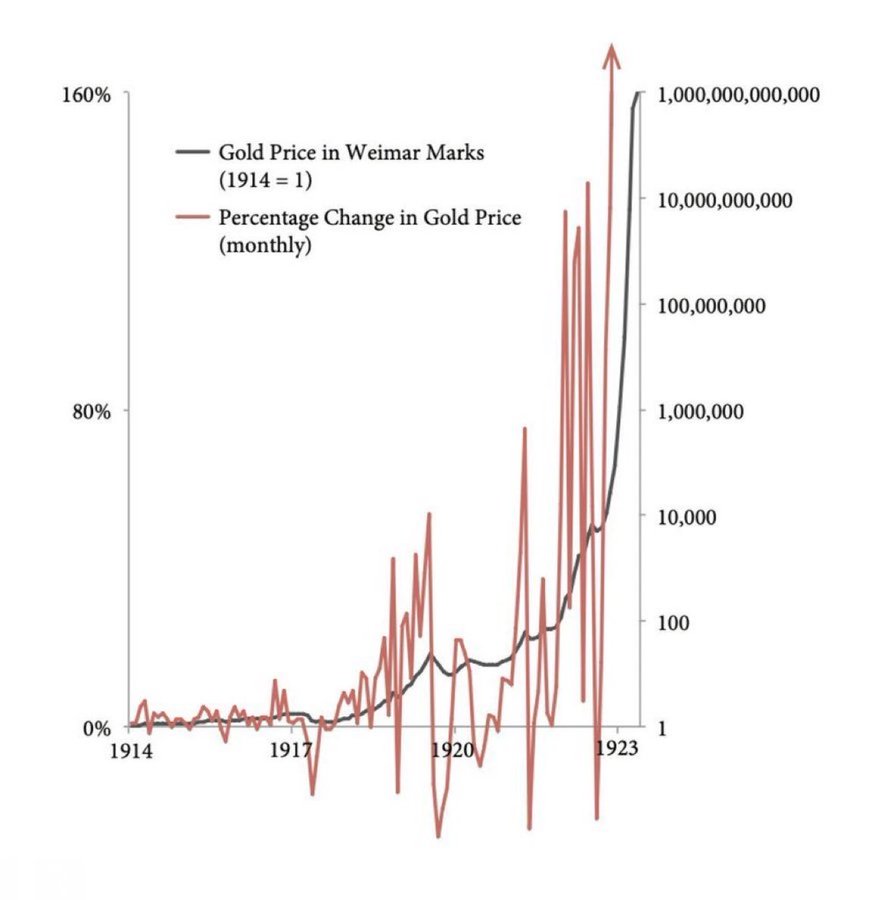
“A chart of the Weimar experience to start off 2026!”
“the chart below serves as an important reminder of the extreme volatility gold experienced during the Weimar period from 1914 to 1925.”
what i have been saying as well. i peg us at about 1923 just about to enter the most destructive phase of it over 2026.
@TaviCosta
It’s hard to ignore what’s happening with silver recently.
What fascinates me is how few are interpreting this move through a hyperinflationary lens.
Instead, the prevailing narrative is that prices are overstretched and due for mean reversion — a view I strongly disagree with.
The chart below serves as an important reminder of the extreme volatility gold experienced during the Weimar period from 1914 to 1925.
From a price-behavior standpoint, the resemblance is hard to ignore, despite obvious differences in today’s political and economic environment.
Let me be clear:
Silver is not making new highs because miners are recklessly deploying capital or because supply is surging.
In fact, we’re seeing the opposite.
There have been no major discoveries, no meaningful supply response, while demand continues to rise structurally, all while a monetary crisis quietly builds.
This is the kind of price behavior typically observed in emerging markets when confidence in the currency is eroding.
Jeremiah Johnson
None of this is trading advice
Bill’s Commentary:
“Posted in case you did not know, or had forgotten…”


Thank you pamelamoves@gmail.com
LikeLike
Feels about right in my guts.
LikeLike
Hi Bill! I
LikeLike
I saw a news alert that the feds just banned ownership and ordered confiscation of silver. Is this true?
LikeLike